‘Shared purpose’ sits at the centre of the BSB Assessment framework. A strong sense of collective purpose is central to the motivation and collaboration that supports an innovative, problem-solving and productive business. Instilling shared purpose means that each individual in that firm needs to be confident of what the organisation is there to do, how it has decided to go about doing it and how they themselves fit into this collective endeavour. It is about — an in a financial services firm, it certainly should be about — having pride in the organisation, both in the value of what the firm does, and in the values that shape how it does this. Firms’ stated values, and the extent to which these values are seen to be demonstrated in the way firms do business — something that is closely linked for many employees with customer focus — has therefore been an area of interest in the BSB’s work.
Most firms and organisations in any sector have a set of stated values. These generally describe what the firm sees as important in the way that it does business, what it expects of its employees and what anyone it employs, serves or engages with should be able to expect in the way that they are treated.
All firms taking part in our Assessment have their own sets of stated values. When we looked at the 25 firms that took part in the BSB Survey in 2017, these 25 sets contained 88 values in total. Many of these, of course, were shared across firms. Sometimes the wording was identical; ‘customer focused’, for example, appears in a number of sets of values. In other cases the wording might be different, but the meaning very similar. Analysing the values of these 25 firms, they fall into eight broad categories, as set out in figure 36.
36. Grouping together firms’ stated values
this includes succeeding together; helping colleagues; common purpose; connected; making a difference together; teamwork; working in harmony; working together; actively collaborating
this includes serving customers; putting customers / clients / members first; respecting customers; customer satisfaction; being customer centred
this includes reliable; straightforward; dependable; simple; responsive
this includes expert; excellence; ingenuity; leadership; rising to challenges; creative; leading with exceptional ideas
this includes doing the right thing; fairness; trust; honesty; standing up for what is right
this includes treating people how they want to be treated; listening; open to ideas and cultures; personal; transparent with customer
this includes commitment to drive the business forward; delivering on shareholder goals; striving for results
this includes responsible finance / investment; giving back; taking responsibility; stewardship; enabling social development; thinking long term; environmentally responsible; building a greener society
Note: This analysis is based on information shared by the 25 firms that took part in the 2017 BSB Assessment
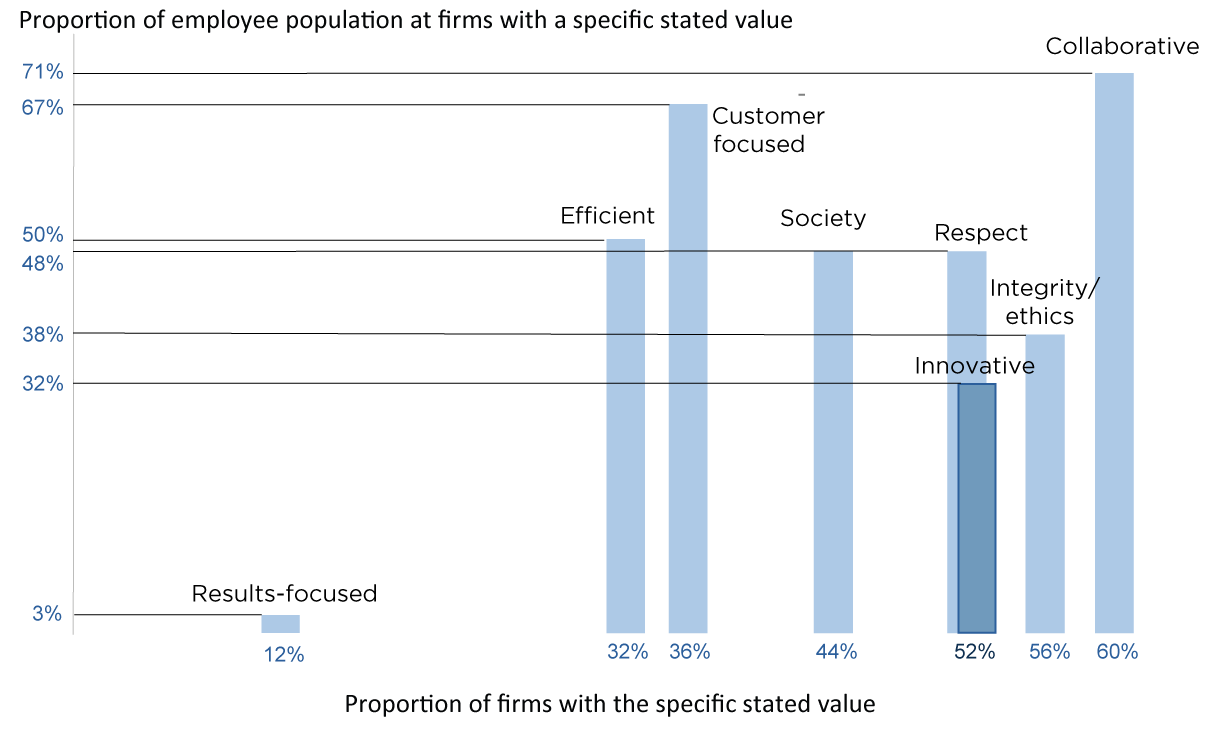
Figure 37 illustrates the distribution of firms’ stated values by the proportion of firms with a particular category of value and by percentage of employees covered by those value categories. The most common category of values found among participating Member firms was ‘collaborative’ (60% of firms), followed closely by ‘integrity/ethics’ (56% of firms), ‘respect’ and ‘innovation’ (each 52% of firms).
Larger firms were more likely to have values relating to ‘collaborative’, ‘customer focus’ and ‘efficient’ meaning that these three categories of values covered a relatively high proportion of employees; ‘collaborative’ (71% of employees), ‘customer focus’ (67%) and ‘efficient‘ (50%).
Fig 37. Distribution of firms’ stated values
It is one thing to have a set of stated values for the organisation; it is another thing for them to be meaningful to employees, and another again to ensure that they are lived in the way that the firm does business.
Q35 of our Survey (figure 38) asks employees if they find their respective firm’s purpose and values meaningful. 84% of employees said in 2018 that they did; 5% that they did not. This was similar to 2017 and an improvement on 2016, when 81% said that they found their firms’ purpose and values meaningful.
Fig 38. BSB Survey Q35 ‘My organisation’s purposes and values are meaningful to me’, at firm level 2016 – 2018
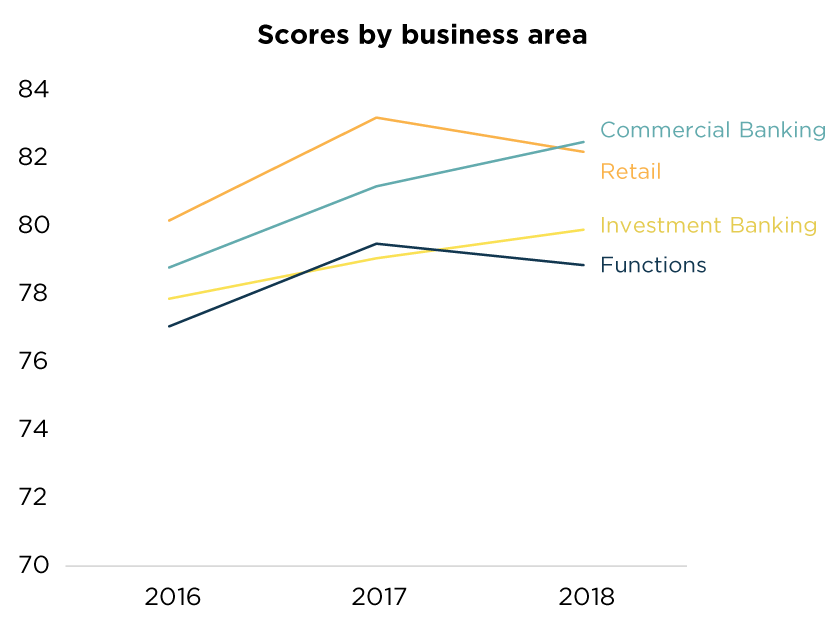
As figure 39 illustrates, scores on this question improved slightly in 2018 in Commercial Banking and Investment Banking, and dipped slightly in Retail and Functions (while remaining above 2016 levels).
Women generally responded more positively than men to Q35, as did employees with line management responsibilities (relative to those without) and employees subject to the Senior Managers Regime (relative to those not in scope of this regime).
Fig 39. BSB Survey Q35 ‘My organisation’s purposes and values are meaningful to me’, by business area 2016 – 2018
Q36 of our Survey then asks employees whether they see any conflict between their firms’ stated values and the way in which business is done.
In 2018, 67% of employees said that there was no conflict between their firms’ stated values and how business was done; 11% did see such a conflict, and one-fifth neither agreed nor disagreed. This again was broadly similar to the results of 2017, holding on to the improvements of 2016.
By business area, the score for this question remains lowest in Functions. Within Functions, employees in IT & Operations were most likely to see a conflict between their firms’ stated values and the way in which business is done.
Fig 40. BSB Survey Q36 ‘There is no conflict between my firm’s stated values and how we do business’, at firm level 2016 – 2018
One of the themes we explored in our focus groups in the 2017 Assessment was that of the alignment of firms’ stated values with the way in which business was, in practice, done. Focus group participants frequently saw this issue through the lens of doing what was in the best interest of customers. This is consistent with our analysis of the Survey results, where we find the results of Q36 ‘There is no conflict between my firm’s stated values and the way we do business’ to be most highly correlated with those of Q9 ‘I believe my organisation puts customers at the centre of business decisions’.
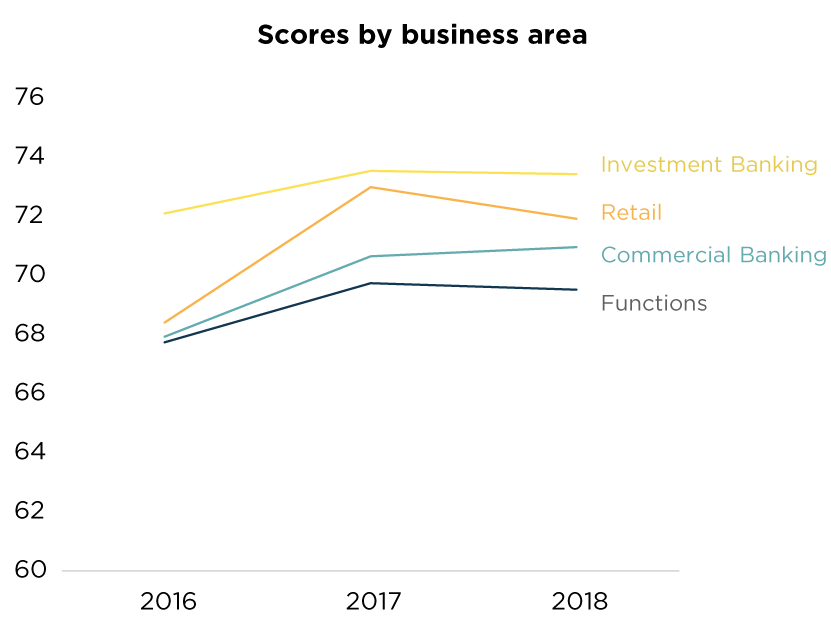
Fig 41. BSB Survey Q36 ‘There is no conflict between my firm’s stated values and how we do business’, by business area 2016 – 2018
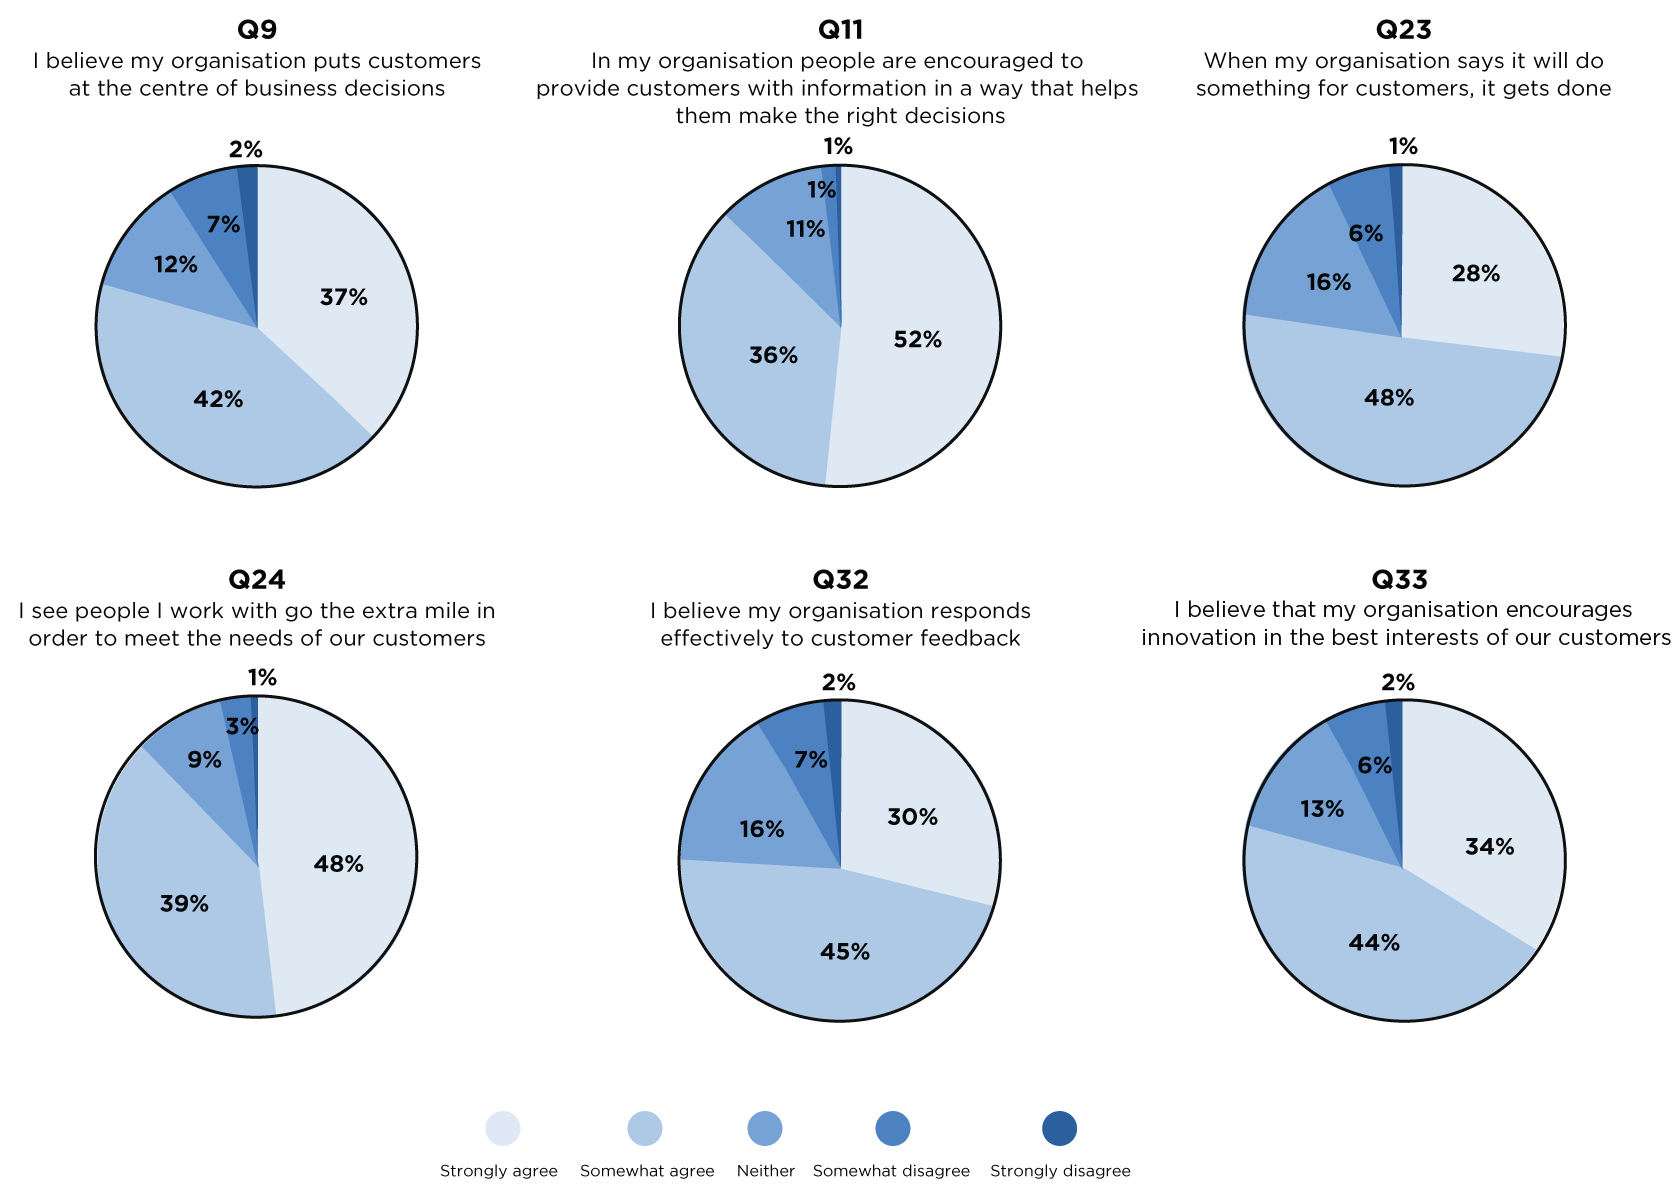
The BSB Survey contains six questions relating to customers. While these questions relate to different characteristics of the BSB Assessment Framework (they inform scores on respect, openness, reliability and responsiveness), we also bring them together and analyse them as a set of ‘customer focus’ questions. The six questions, and the way in which respondents answered them in 2018, are shown in figure 42. As with the pattern across Survey scores in general, scores on the customer focus cluster of questions were stable in 2018 after improvements the previous year.
Fig 42. BSB Survey 2018 responses to customer-related questions (Q9, Q11, Q23, Q24, Q32 and Q33)
In 2018, we asked focus group participants in Retail (24 focus groups) and Commercial Banking (seven focus groups) to tell us about what their firms were doing well and less well on the topic of customer focus.
A range of practices and issues were mentioned by participants in the context of these discussions. Having identified and categorised these practices, we analysed what was said in each focus group to get a sense of whether the balance of views on each practice was positive, mixed or negative, or of course if no views were expressed at all. Having obtained the balance of sentiment on each issue for each focus group, we then aggregated these to give us a picture of the net balance on each issue in both Retail and Commercial Banking. This picture is shown in figure 43.
This approach does not take account of the proportion of employees in each area of a firm, or the size of the firm in the sector. It also reflects only the extent to which issue were mentioned and whether the context was, on balance, positive or negative; it does not try to take into account the strength of feeling involved or the numbers within the focus group holding that view. It may, nevertheless, be useful to firms in confirming or informing their understanding about the issues employees see as constraining or supporting them in serving customers well.
Fig 43. Analysis of qualitative evidence gathered from focus groups on customer focus

Complex internal systems and processes, and outdated technology, were the factors most commonly cited by focus group participants as problematic. They said that dealing with customers was often systems-driven, making it difficult to meet customers’ needs flexibly, and that teams and departments could be reluctant to take ownership of customer issues that did not fit neatly prescribed criteria, creating delays in responding. That sentiment on this issue was particularly negative in Commercial Banking. This is consistent with the BSB Survey results. In 2018, Survey respondents in Commercial Banking were more likely than those in any other business area to describe their firm as bureaucratic (Q37), while 62% — a markedly higher proportion than in any other business area — said that internal practices and processes were a barrier to continuous improvement (Q31).
At the opposite end of the sentiment scale, focus group participants in both Retail and Commercial Banking were most positive about the methods and tools that their firms had developed to provide information in appropriate ways to a range of customers. This is again consistent with the Survey results. In 2018, 88% of respondents said that people in their firm were encouraged to provide information to customers in a way that helped them make the right decision, with only 2% disagreeing (Q11).
One additional factor that was mentioned by focus groups in both Retail and Commercial Banking when discussing customer focus, but that did not lend itself to being captured in a simple positive/ negative sentiment balance and so is not included in figure 43, was performance management — the firm’s approach and the metrics used. Reward and incentive structures are an important influence on behaviour. As Dr Celia Moore noted at a BSB breakfast event in 2018, if individuals are presented with a mixed basked of objectives, most of which are qualitative and one of which has a number attached to it they are more likely to focus on the one with the number. Employees talked about the increased emphasis now being given to the quality of customer relationships (as opposed to just the quantity) in reward structures, which they saw as facilitating good customer service. Discussions in some focus groups, however, also suggested that, where sales targets had been removed, they sometimes remained implicit in practice; something that firms will wish to be alert to.